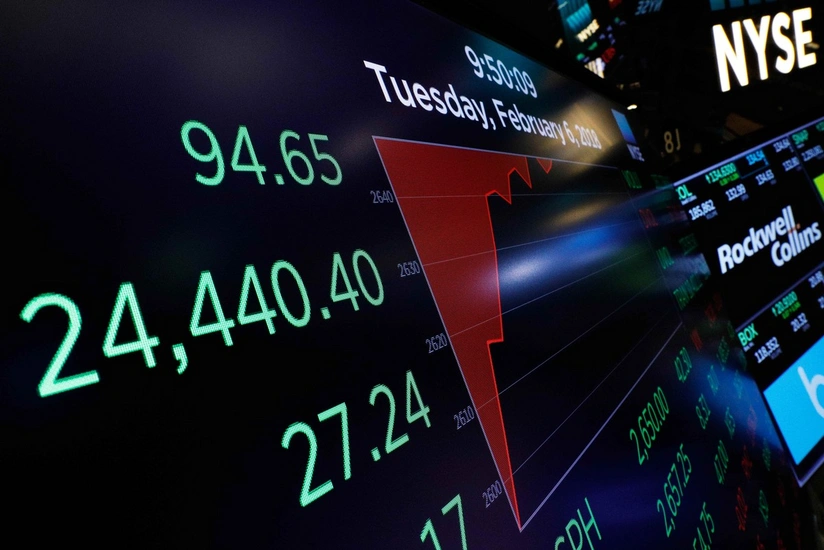
Key indicators of world commodity, stock, and currency markets (13.02.2024)
Finance
- 13 February, 2024
- 05:02

| Current price | Compared to the previous day’s close | Compared to the beginning of the year | |
| Commodity | |||
| Brent (dollar/barrel) | 82.06 | -0.13 | 5.02 |
| WTI (dollar/barrel) | 77.03 | 0.19 | 5.38 |
| Gold (dollar/ounce) | 2,032.80 | - 5.90 | - 39.00 |
| Indices | |||
| Dow-Jones | 38,797.38 | 125.69 | 1,107.84 |
| S&P 500 | 5,021.84 | - 4.77 | 252.01 |
| Nasdaq | 15,942.55 | - 48.11 | 931.20 |
| Nikkei | 37,832.63 | 935.21 | 4,368.46 |
| Dax | 17,037.35 | 110.85 | 285.71 |
| FTSE 100 | 7,573.69 | 1.11 | - 159.55 |
| CAC 40 INDEX | 7,689.80 | 42.28 | 146.62 |
| ShanghaiComposite | 2,865.90 | 0.00 | - 109.04 |
| BIST 100 | 9,174.58 | 128.61 | 1,704.40 |
| RTS | 1,120.94 | - 1.44 | 37.46 |
| Currency | |||
| USD/EUR | 1.0763 | 0.0000 | - 0.0300 |
| GBP/USD | 1.2612 | 0.0000 | - 0.0100 |
| USD/JPY | 149.5200 | 0.2300 | 8.4800 |
| USD/RUB | 91.2220 | 0.0700 | 1.7500 |
| USD/TRY | 30.7214 | 0.0300 | 1.1900 |
| USD/CNY | 7.1936 | 0.0000 | 0.0900 |
Latest News
20:41
US sanctions 15 entities, 14 ships for trading Iranian oil, State Dept says
Region20:19
Azerbaijani President approves regulations for Akhar-Bakhar and Ilisu National Parks
Domestic policy20:12
EU proposes 20th package of sanctions against Russia
Other countries19:51
Photo
Azerbaijan Naval Forces commander visits Pakistan
Military19:30
European Commission clears acquisition of SOCAR Terminal by STEAS and TISS
Energy19:17
Azerbaijan resumes avocado imports from Spain
Business19:06
Iranian FM: Today's talks were a good start
Region18:48
Azerbaijan presents note of protest to Russian ambassador
Foreign policy18:26
