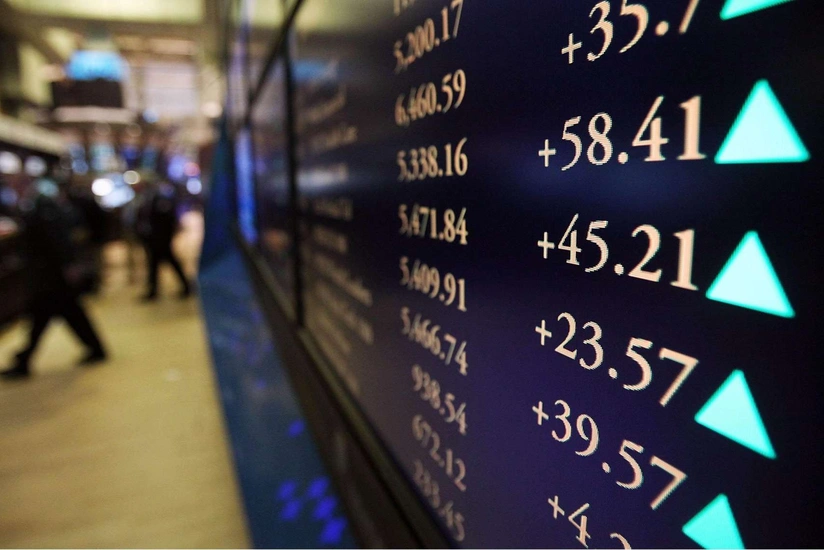
Key indicators of world commodity, stock, and currency markets (03.10.2023)
Finance
- 03 October, 2023
- 05:19

| Current price | Compared to the previous day’s close | Compared to the beginning of the year | |
| Commodity | |||
| Brent (dollar/barrel) | 89.83 | - 5.55 | 6.37 |
| WTI (dollar/barrel) | 88.15 | - 3.56 | 9.75 |
| Gold (dollar/ounce) | 1,836.70 | - 41.90 | 6.60 |
| Indices | |||
| Dow-Jones | 33,433.35 | - 74.15 | 286.10 |
| S&P 500 | 4,288.39 | 0.34 | 448.89 |
| Nasdaq | 13,307.77 | 88.45 | 2,841.29 |
| Nikkei | 31,284.65 | - 572.97 | 5,190.15 |
| Dax | 15,247.21 | - 139.37 | 1,323.62 |
| FTSE 100 | 7,510.72 | - 97.36 | 58.98 |
| CAC 40 INDEX | 7,068.16 | - 66.90 | 594.40 |
| ShanghaiComposite | 3,110.48 | 0.00 | 21.22 |
| BIST 100 | 8,486.96 | 152.02 | 2,977.80 |
| RTS | 992.18 | -115.40 | 50.83 |
| Currency | |||
| USD/EUR | 1.0464 | - 0.0100 | - 0.0200 |
| GBP/USD | 1.2067 | - 0.0100 | 0.0000 |
| USD/JPY | 149.8600 | 0.5500 | 18.7400 |
| USD/RUB | 99.1172 | 2.3100 | 25.3700 |
| USD/TRY | 27.5041 | 0.1000 | 8.8100 |
| USD/CNY | 7.2980 | 0.0000 | 0.4100 |
Latest News
17:54
Magnitude 5.5 earthquake strikes Cuba, EMSC says
Other countries17:29
Avalanches in Italy kill three off-piste skiers in Winter Olympics regions
Other countries17:03
Turkish MFA extends condolences to Sudan
Region16:36
Azerbaijani, Turkish FMs discuss bilateral and regional issues
Foreign policy16:15
Sudan drone attack kills 24 people, including eight children
Other countries15:50
Dark matter could be masquerading as black hole at Milky Way's core
Education and science15:23
Attacker and his accomplice in assassination attempt on Russian general nabbed — FSB
Region15:07
Washington Post publisher Will Lewis resigns just days after paper enacts mass layoffs
Other countries14:51
