") https://static.report.az/photo/9fbc8722-9f0d-4120-97b0-2e3329caa2ee.jpg
https://static.report.az/photo/9fbc8722-9f0d-4120-97b0-2e3329caa2ee.jpg
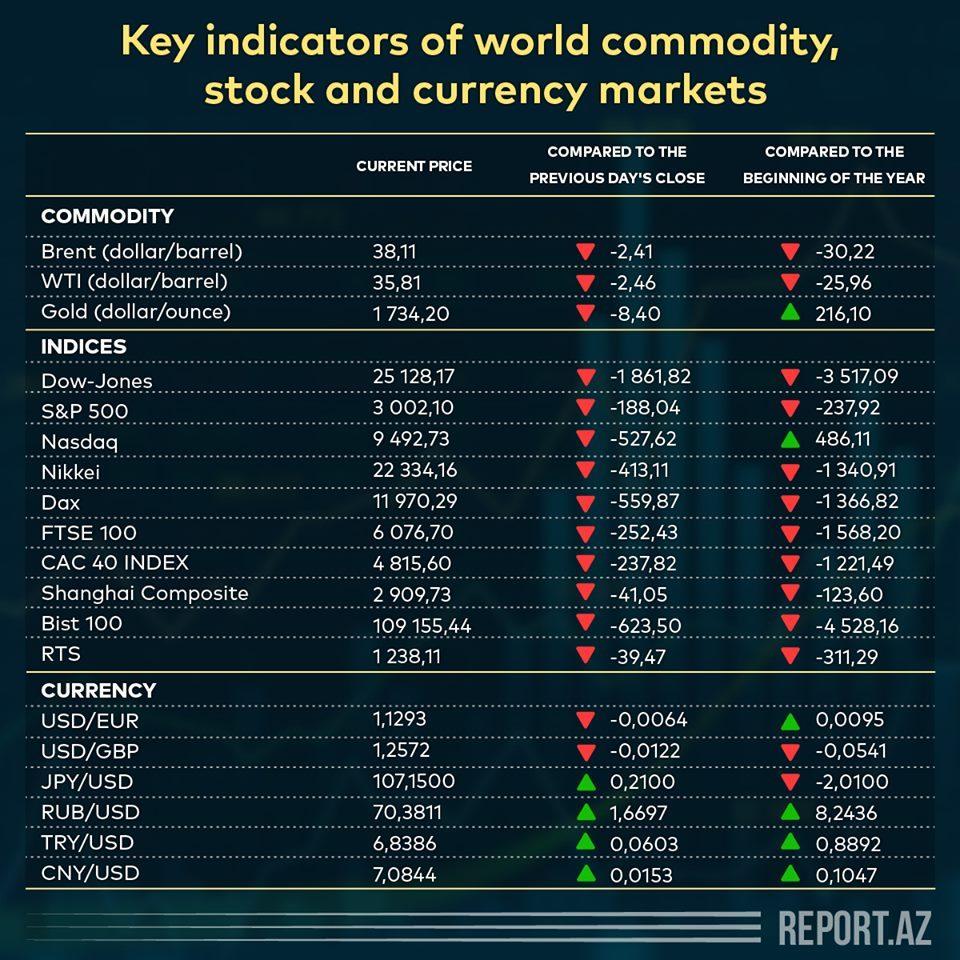
| Current price |
Compared to the previous day's close |
Compared to the beginning of the year |
|
| Commodity | |||
| Brent (dollar/barrel) | 38.11 | - 2.41 | - 30.22 |
| WTI (dollar/barrel) | 35.81 | - 2.46 | - 25.96 |
| Gold (dollar/ounce) | 1,734.20 | - 8.40 | 216.10 |
| Indices | |||
| Dow-Jones | 25,128.17 | - 1,861.82 | - 3,517.09 |
| S&P 500 | 3,002.10 | - 188.04 | - 237.92 |
| Nasdaq | 9,492.73 | - 527.62 | 486.11 |
| Nikkei | 22,334.16 | - 413.11 | - 1,340.91 |
| Dax | 11,970.29 | - 559.87 | - 1,366.82 |
| FTSE 100 | 6,076.70 | - 252.43 | - 1,568.20 |
| CAC 40 INDEX | 4,815.60 | - 237.82 | - 1,221.49 |
| Shanghai Composite | 2,909.73 | - 41.05 | - 123.60 |
| BIST 100 | 109,155.44 | - 623.50 | - 4,528.16 |
| RTS | 1,238.11 | - 39.47 | - 311.29 |
| Currency | |||
| USD/EUR | 1.1293 | - 0.0064 | 0.0095 |
| USD/GBP | 1.2572 | - 0.0122 | - 0.0541 |
| JPY/USD | 107.1500 | 0.2100 | - 2.0100 |
| RUB/USD | 70.3811 | 1.6697 | 8.2436 |
| TRY/USD | 6.8386 | 0.0603 | 0.8892 |
| CNY/USD | 7.0844 | 0.0153 | 0.1047 |